
Speed in the digital world is everything. The slow operation of the websites or applications used creates negative effects especially on the quality offered by the end-users to the service or service providers. If pages are loaded slowly or errors are encountered in online shopping platforms, this leads to loss of sales and customers.
Measurements are needed to manage performance-related business losses like this. The main step of this process is to monitor the behaviour and responses of the components of different architectural layers of applications in order to eliminate the efficiency losses caused by trying to manage the things we cannot measure and even achieve to a proactive action plan.
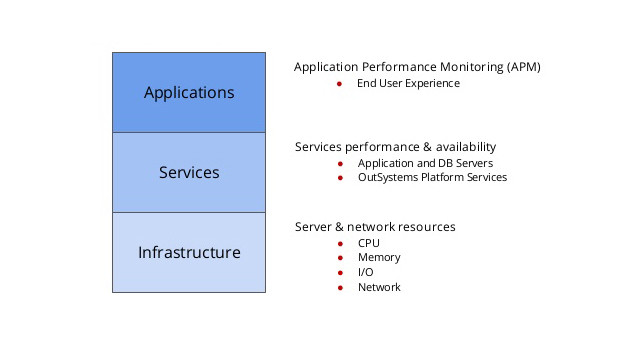
In order to address the errors of the application, monitoring is carried out at 3 main levels as shown below.
Application Level Monitoring
After measuring the performance of each web request and process in applications, it is determined which requests are reached the most, which are the slowest, and which ones they need to work on to improve. Monitoring web requests is just the beginning. The main purpose is to identify the main cause.
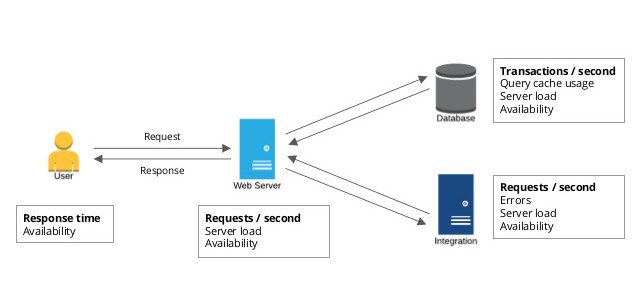
The slow running of the application can often be caused by an increase in traffic load, a bottleneck in database queries or an error in one of the application dependencies. Things to be observed:
- Details of URL and similar network requests (Fail / Pass rates, Average response or processing times, etc.)
- Dependencies invoked by the application (Cache, SQL, HTTP service calls etc.)
- Application errors
- Daily records
- Business critical methods
Monitoring at Server Level
Within the scope of hardware monitoring, it is important to monitor components such as CPU and memory of the server. Modern apps can use a lot of CPU and this can be a useful metric to scale the servers. For many reasons, performance problems occur in various ways e.g. network connection related problems, memory leaks, virtualization bottlenecks, storage hotspots. Server monitoring must be performed in the context of application monitoring in this regard.
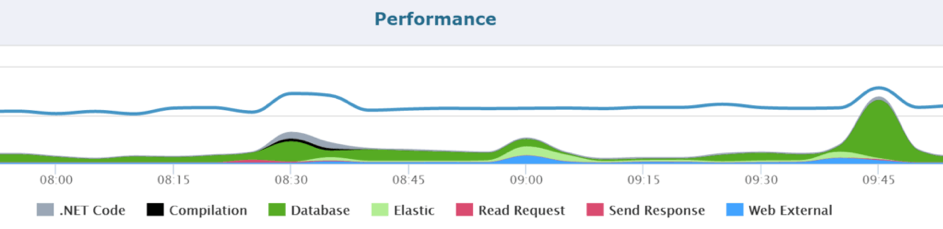
However, software metrics for developers may be necessary to determine actual application performance. Developers need to track metrics about like garbage collection, queuing request, transaction volumes, page load times. Developers can monitor various Windows Performance Counters and JMX MBeans’ metrics. It may also make sense to track the metrics of key components such as Redis, Elasticsearch, SQL.
Code Level Monitoring
If you want to know why the methods are slow, throwing errors, or what kind of errors are in the application, you require to perform the code level monitoring. This approach is implemented by placing agents on application servers. These agents collect response time and error information about processes processed by servers.
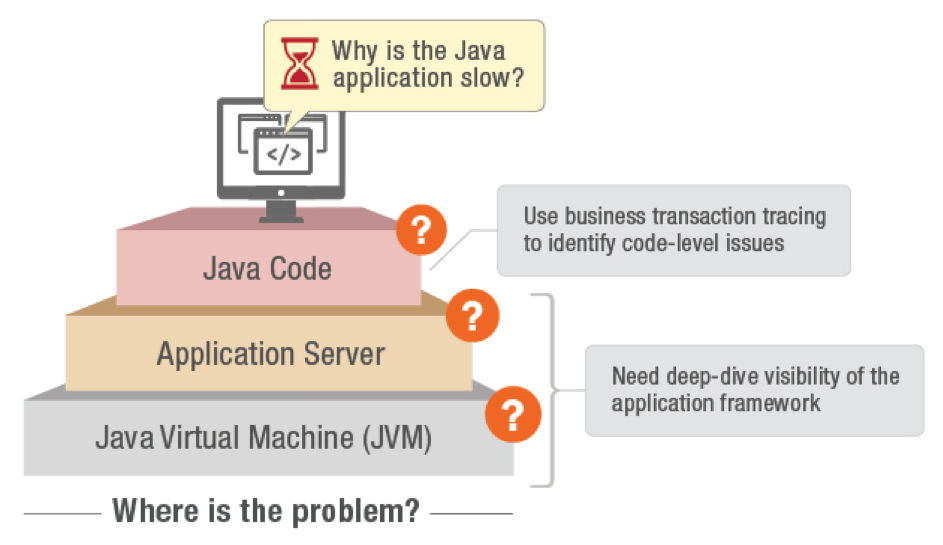
When slowdown is detected on the application server, the developer needs to be sure if there is a problem with the application code. Creating a process profile usually provides developers and application owners with the ability to drill down into code detail and get process time breakdown at the method level. When a user process is slow, it is possible to pinpoint the exact location of the code, database query or third-party call with high processing time.
Here are a few examples where you can find out what is going on by going down to the code level in your application:
- Which part of the application code is incorrect or slow
- Critical methods and dependencies called by the application code
- The effects of operations such as JIT, garbage collection
Berk Toprakçı
Software Test Automation Engineer